Early warning of MIB episode based on gene abundance and expression in drinking water reservoirs
Keywords
2-methylisoborneol (MIB), MIB synthesis gene, Pseudanabaena, Prediction, Light intensity, Gene expression, Reservoir
Tengxin Cao1,6,7, Jiao Fang1, Zeyu Jia3,1, Yiping Zhu4, Ming Su1,2,7,*, Qi Zhang5, Yichao Song4, Jianwei Yu1,2,7, Min Yang2,1,7,*
1. Key Laboratory of Drinking Water Science and Technology, Research Center for Eco-Environmental Sciences, Chinese Academy of Sciences, P.O. Box 2871, Beijing, 100085.
2. National Engineering Research Center of Industrial Wastewater Detoxication and Resource Recovery, Research Center for Eco-Environmental Sciences, Chinese Academy of Sciences, P.O. Box 2871, Beijing, 100085.
3. Yangtze Eco-Environment Engineering Research Center, China Three Gorges Corporation, Beijing, 100038.
4. Shanghai Chengtou Raw Water Co. Ltd., Beiai Rd. 1540, Shanghai, 200125.
5. Institute of Hydrobiology, Chinese Academy of Sciences, No. 7 Donghu South Road, Wuchang, Wuhan, 430072.
6. Sino-Danish College, University of Chinese Academy of Sciences, Beijing, 100049.
7. University of Chinese Academy of Sciences, Beijing, 100049.
* Corresponding Author: Min Yang (yangmin@rcees.ac.cn)
Abstract
Cellular 2-methylisoborneol (MIB) yield of cyanobacteria varies under different conditions according to culture studies and field investigations, the causal mechanism remains unclear and results in ineffective MIB prediction. Through an intensive field survey during an MIB episode produced by Pseudanabaena cinerea in QCS reservoir, we demonstrated that MIB synthesis (mic) gene abundance (DNA) and expression (RNA) might be useful as parameters for early warning of MIB production. It was found that the abundance of mic DNA and RNA peaked ahead of MIB concentrations by 10 and 7 days, respectively. In addition, the RNA abundance (R2 = 0.45, p < 0.01) showed a slightly higher correlation with MIB compared to DNA abundance (R2 = 0.37, p < 0.01), suggesting that the conditions for the growth of Pseudanabaena cinerea might be slightly different from those for mic gene expression, which was verified by a culture experiment. The highest cell growth was obtained under 36 μmol photons m-2 s-1, while the highest cellular MIB yield and mic gene expression level were obtained under 85 μmol photons m-2 s-1. Our results clearly supported that light intensity was the virtual regulator governing the mic gene expression within the controlled culture experiment and the actual MIB episode in the reservoir. Besides these results, we developed an early warning model using mic gene abundance as an indicator of MIB episodes, which was verified in two other reservoirs. Our findings highlight the effect of light intensity on mic gene expression and MIB synthesis and provide an early warning tool targeting MIB episode prediction, which therefore should be of importance for source water authorities.
Keywords: 2-methylisoborneol (MIB); MIB synthesis gene; Pseudanabaena; Prediction; Light intensity; Gene expression; Reservoir.
Introduction
Taste and odor issues, particularly the musty odor caused by 2-methylisoborneol (MIB), have become a major challenge for water quality (Izaguirre and Taylor, 2007; Lanciotti et al., 2003; Sun et al., 2013; Yang et al., 2008). If the MIB concentration in source water is over 400 ng L-1, for example, dosing with powdered activated carbon alone may not be enough to achieve the goal of <10 ng L-1 (odor threshold concentration) in purified water (Cook et al., 2001; Zamyadi et al., 2015). Although MIB was first identified as the volatile secondary metabolite produced by actinomycetes (Gerber, 1979), filamentous cyanobacteria including Pseudanabaena, Planktothrix, Phormidium, Oscillatoria, Lyngbya, Planktothricoides, etc. are the major producers of MIB in drinking water sources (Lu et al., 2022; Persson, 1996; Su et al., 2015; Watson et al., 2016; Watson et al., 2008). MIB concentration in actual water is governed by the growth of MIB producer(s), the expression level of MIB synthesis gene and hydrological transportation of MIB diffusion. Water temperature, nutrients, light availability, and hydrodynamics have been revealed as the driving factors affecting the growth of MIB producers based on field investigation and culture experiments (Jia et al., 2019; Kakimoto et al., 2014; Wang and Li, 2015). In comparison with scum-forming cyanobacteria, the growth of which is mainly driven by nutrient availability, the driving forces for the growth of MIB producers are quite complicated. Because of their relatively large cellular sizes, these filamentous cyanobacteria have a strong capacity to harness light energy (Halstvedt et al., 2007; Su et al., 2014), which allows them to live in low-light conditions (Su et al., 2019). Such a feature, however, makes them susceptible to competition from other cyanobacteria, leaving a narrow niche for themselves in natural reservoirs/lakes (Su et al., 2019). Accordingly, MIB producers are usually not the dominant cyanobacteria species in a particular water system, and their occurrence and MIB episodes only last for normally no longer than 2 months (Izaguirre and Taylor, 2007; Su et al., 2021, 2015; Wu et al., 2021). Nevertheless, cellular MIB yields still show great variation during that period, even when the water temperature and nutrient conditions are rather stable (Chiu et al., 2016; Huang et al., 2018), suggesting that the ambient environmental factors not only govern the growth of MIB producers, but also affect cellular MIB productivity. Furthermore, MIB is synthesized through the isoprenoid pathway, and shares a common precursor geranyl pyrophosphate (GPP) with photosynthesis pigments chlorophyll a (chl a), Carotenoids, and Xanthophylls in cyanobacteria (Zimba et al., 1999), suggesting that MIB production is a light-dependent process. In addition to solar irradiance, light availability is also governed by the water extinction coefficient and mixing depth. Therefore, we speculate that underwater light availability could possibly be an important driving factor for the growth of MIB producers as well as MIB biosynthesis in natural water bodies, which makes the MIB episodes quite unpredictable based on traditional methods (Chiu et al., 2016; Huang et al., 2018). This has created a difficult situation for waterworks trying to adjust their treatment processes.
Quantification of functional genes has been regarded as a potential method for cyanobacterial metabolite prediction, e.g., the toxin-encoding genes have been used to predict microcystin production by as much as 7 days in advance (Lu et al., 2020). The pathway of MIB biosynthesis is nearly the same in cyanobacteria (Giglio et al., 2011; Wang et al., 2011) and actinomycetes (Komatsu et al., 2008). It consists of two main steps from the precursor geranyl diphosphate (GPP), including 1) a methylation process from GPP to methyl-GPP catalyzed by methyltransferase (GPPMT), and 2) a cyclization process from methyl-GPP to MIB by MIB synthase (MIBS). These two processes do not fully match with cyanobacteria taxonomy, so cell morphology-based cyanobacteria identification is therefore unable to distinguish the MIB producers making it difficult to evaluate the MIB production in drinking water reservoirs/lakes. Thus, the abundance of genes associated with GPPMT/MIBS and their expression have merit as fundamental indicators for MIB episodes, as verified in field studies (Chiu et al., 2016; Kim et al., 2020; Lu et al., 2019; Rong et al., 2018; Wang and Li, 2015). In view of the fact that the sequences of the two genes vary somewhat among strains, we have developed a pair of universal primers (MIBQSF/R) targeting the MIBS gene (mic gene) of all known MIB-producing strains, and validated it to be MIB-specific based upon samples from 9 reservoirs and 17 cultured strains (Suruzzaman et al., 2022). In addition to the presence of the gene in the genome, the expression of the mic gene is also essential to the biosynthesis of MIB. Therefore, it may be possible to use mic gene abundance and expression to predict the occurrence and strength of MIB episodes.
On the basis of the description from above literatures and our previous studies, we proposed the hypothesis that light intensity is a more important regulator of MIB synthesis gene expression compared to water temperature and nutrient concentrations for an actual MIB episode. A systematic field investigation was performed in Qingcaosha (QCS) Reservoir including the spatial and temporal distributions of MIB, MIB producers and mic gene abundance/expression. At the same time, the effect of light intensity on the cell growth, MIB production, cellular MIB yield and mic gene expression of the MIB-producing Pseudanabaena strain (Pseudanabaena cinerea FACHB 1277) were determined through culture experiments. Finally, valid early warning indicators targeted for MIB prediction were proposed and applied to drinking water reservoirs.
Methods and Materials
Study area and sampling sites
QCS Reservoir (32o27’N, 121o38’E, Fig. S1, Fig. S2), located in the estuary of the Yangtze River, is the major source of drinking water for Shanghai (Su et al., 2021), and has suffered from MIB problems for several years. The reservoir has the maximum storage capacity of 437.5 GL and the surface area of 66.15 km2. According to the temperature profile observed in our previous study, the water bodies showed the well vertical mixed characteristics year-round. A total of 19 sampling sites were selected from Upstream river water (1 site), North branch (3 sites), South branch (4 sites), and Middle section (11 sites) to investigate the spatial distribution of MIB concentrations in 2021 (Fig. S1, Table S1) according to bathymetry (Fig. S2). According to the temperature profile observed in our previous study (Su et al., 2021), the water bodies showed the well vertical mixed characteristics year-round. Since this reservoir is well-mixed, 5 L water samples from the surface layer (0.5 m) of all sites were collected by Kemmerer water sampler weekly for physico-chemical measurement, algal enumeration, and molecular detection during an MIB episode. Meanwhile, daily sampling was conducted in QC10 (located in the North branch, Fig. S1) to follow the temporal dynamics of MIB and related gene abundances. All samples were stored at 4 °C within 24 h until use.
MIB concentrations were determined using solid-phase micro-extraction (SPME) coupled with gas chromatography-mass spectrometry (GC-MS) (Su et al., 2015). The physico-chemical properties including water temperature, dissolved oxygen (DO), pH, and turbidity were measured using a multiple-probe instrument (EXO2, Xylem, USA) in-situ. Water transparency, expressed as secchi depth (SD), was measured by a Secchi disk (diameter: 20 cm, black and white). Total phosphorus (TP), total nitrogen (TN), nitrate nitrogen (NO3-N) and ammonia nitrogen (NH4-N) were measured according to the national water quality standards of China. Air temperature and solar irradiance were obtained from the China Meteorological Data Service Center (CMDC). The water level and inlet/outlet volume were obtained from the reservoir authority. Hydraulic retention time (HRT) was determined based on inlet/outlet volume and reservoir storage. The 100 mL subsamples for phytoplankton cell counting were preserved with 5 % Lugol’s iodine and concentrated to 10 mL after sedimentation for 48 h. Cell counting was performed using a counting chamber (S52, 1 mL, Sedgewick-Rafter) under a microscope (OLYMPUS BX51, Olympus Optical, Tokyo, Japan), and the cyanobacterial species was identified according to (Komarek et al., 2014). The filamentous cyanobacteria abundances were quantified based on the length of each filament and the mean cell length of each strain, and the number of cells in colony species such as Microcystis sp. was estimated based on colony volume and mean cell density. The mean cell morphological characteristics including cell length, cell volume etc. were determined according to more than 50 filaments/colonies of each strain using a self-developed cell-counting tool (CCT v1.4, https://drwater.rcees.ac.cn, in Chinese); more details can be found in (Su et al., 2015). Jinze (JZ) Reservoir (31o03’N, 120o95’E) and Lianghui (LH) Reservoir (29o98’N, 121o16’E) were selected to validate the mic gene-based early warning method, and the samples collection, storage, and analysis methods were the same as those of QCS Reservoir.
DNA and RNA extraction
A total of 152 water samples from QCS, JZ, and LH reservoirs were collected for molecular detection, respectively. The 500 mL subsamples were filtered by 1.2 μm IsoporeTM Membrane Filters, then the membrane filters were stored at -20 °C in 1.5 mL centrifuge tubes until DNA and RNA extraction. The DNA and RNA of water samples were extracted using the Fast DNA TM spin kit for soil (MP Biomedicals, USA) and E.Z.N.A.TM Soil RNA Kit (OMEGA, USA), respectively. PrimeScriptTM RT Master Mix (TaKaRa, Japan) was used to reverse transcribe RNA to cDNA, performing the reaction at 37 °C for 15 min followed by 85 °C for 5 s. The concentration and purity of DNA and cDNA were identified by microspectrophotometry (NanoDropND-2000, NanoDrop Technologies, Willmington, DE). DNA and cDNA samples were stored at -80 °C until use.
Quantification of mic gene
The primers MIBQSF (5’-GACAGCTTCTACACCTCCATGA-3’) and MIBQSR (5’-CAA TCTGTAGCACCATGTTGAC-3’) were used to amplify the cyanobacterial mic gene (Suruzzaman et al., 2022). The quantitative PCR was carried out in a 25 µL volume mixture including 12.5 µL TB GreenTM Premix Ex TaqTM (TaKRa, Japan), 0.8 µL for each primer (MIBQSF and MIBQSR), 8.9 µL deionized water, and 2 µL template DNA. The quantitative PCR was conducted using LightCycler 96 (Roche, USA), and the reaction conditions were pre-incubation at 95 °C for 10 min; 50 cycles at 95 °C for 20 s, 50 °C for 20 s, and 72 °C for 20 s; and DNA melting from 65 °C to 97 °C. The specification of qPCR amplification protocol was verified using 12 MIB-producing cyanobacteria and 5 non-MIB producing cyanobacteria, no non-specific amplicon was found in gel image (Suruzzaman et al., 2022). Standard curves were obtained by dilution from linearized plasmids containing between 1010 and 104 mic gene copies μL-1, and all the measurements were conducted in triplicate. The standard curve was obtained: \(C_q = -3.4537 lg (c_{mic}) + 40.13 (R^2 = 0.999, p < 0.0001)\) with the efficiency of 95% (Fig. S3). Negative control was used to distinguish the specific and non-specific amplification (Fig. S4).
Identification of MIB producers
We combined multiple methods including high-throughput sequencing and pure culture to identify the MIB producers in QCS Reservoir. Firstly, considering the cyanobacteria and actinomycetes have the potential to produce MIB in natural water bodies but they have different gene order in MIB operon (Devi et al., 2021), the genetic information of mic genes can be used to identify the MIB producers. Here, nanopore sequencing (with long reads that can span the MIB operon (about 5000 bp)) was used to investigate the genetic environment of mic genes in QCS Reservoir and further identify the MIB contribution of cyanobacteria or actinomycetes. Environmental DNA was prepared for library construction, large DNA fragments were recovered using the BluePippin automatic nucleic acid recovery system (Sage Science), and then purified using magnetic beads. The two ends of purified DNA were repaired and connectors were added. These constructed libraries were sequenced on the Oxford Nanopore Technology (ONT) platform. Raw data were preprocessed by Trimmomatic (v.0.36) to obtain clean data. Further, the clean data were mixed and assembled to Scaftigs using MEGAHIT (v.1.0.6), then the Scaftigs shorter than 500 bp were filtered for subsequent analysis. The mic gene in the Scaftigs was determined by BLASTN with mic gene sequences obtained from the National Center for Biotechnology Information (NCBI) GenBank. The sequencing data were submitted to the NCBI BioProject database with accession number PRJNA844292.
In addition, sequencing of the mic genes of environmental DNA can provide clues to explore the communities of potential MIB producers (Qiu et al., 2021). topHL)Zhe primers MIBQSF (5’-GACAGCTTCTACACCTCCATGA-3’) and MIBQSR (5’-CAATCTGTAGCACCATGTTGAC-3’) with barcode sequences at two ends were used to amplify the mic genes of environmental samples (Suruzzaman et al., 2022). Purified amplicons were paired-end sequenced on the Illumina MiSeq PE300 platform (Illumina Inc., San Diego, USA). Paired-end reads were merged by the FLASH program (Magoc and Salzberg, 2011). Then the sequences were clustered to operational taxonomic units (OTUs) by UPARSE with 97% similarity cutoff (Edgar, 2013), and the singletons and chimeras were removed. Representative sequences of OTUs were blasted with mic gene sequences obtained from the National Center for Biotechnology Information (NCBI) GenBank to identify the contributors to mic genes. The sequencing raw data were submitted to NCBI BioProject database with accession number PRJNA838781.
Finally, the potential MIB producers were isolated and their MIB production abilities were confirmed. A single filament was picked up under the microscope and washed with sterile ddH2O several times until the only target filament was obtained. The isolated Pseudanabaena were cultured under 25 °C and light intensity of 30 μmol photons m-2 s-1 in BG11 medium. GC-MS was used to identify the MIB production abilities of these isolated strains. Taxonomic classification was confirmed by 16S rRNA gene sequencing, with the primers 27F (5’-AGAGTTTGATCCTGGCTCAG-3’) and 1492R (5’-TACGGCTACCTTGTTACGACTT-3’). Three strains of Pseudanabaena were isolated from MIB episode water samples in QCS Reservoir.
Culture experiment for Pseudanabaena
Pseudanabaena cinerea FACHB 1277 obtained from the Freshwater Algae Culture Collection at the Institute of Hydrobiology was used to investigate the effects of light intensity on the cell growth, MIB production, and mic gene expression level during the culture period of 35 days. Cells of Pseudanabaena in the logarithmic growth phase were centrifuged (1000 RPM, 2 min) and washed 3 times with BG11 medium to remove the extracellular odorous substances. The subsequent culture experiments were performed at a cell density of approximately 2 × 10⁶ cells L-1 based on the cell concentrations observed in QCS Reservoir during the field investigation.
Pseudanabaena were cultured in triplicate at 25 °C under a 12 h/12 h light/dark cycle in 30 mL BG11 medium, under different light intensities of 5, 17, 36, 85, and 250 μmol photons m-2 s-1, respectively, according to the variations of light intensities in QCS Reservoir during the MIB episode (15.7 ~ 51.1 μmol m-2s-1).
Statistical analysis
Non-metric multidimensional scaling analysis (NMDS) was first proposed by (Kruskal, 1964), and have been extensively used to explore the temporal and spatial transitions of phytoplankton communities with in Primer v7 ((Clarke and Gorley, 2015)), and the differences between the communities were tested using the permutational multivariate analysis of variance (PERMANOVA, (Anderson, 2017)) with 9999 permutations by the Bray-Curtis dissimilarity matrix, performed by the vegan package (Dixon, 2003) based on R language (R Core Team, 2020). The advance days of the mic gene-based early warning method were determined by conducting time-shifted pairwise Pearson’s correlation analysis. The correlations between MIB concentration and mic gene (DNA and RNA) abundance were screened with different lag days (Δd) from 0 to 14. The lag day with the highest correlation was further determined as the advance time for early warning of the MIB episode.
The underwater light intensity in QCS Reservoir is determined by solar irradiance and mixing characters of reservoir water, and can be calculated by (Eq. 1) as follows:
\[ I_c=I_u\frac {1-e^{-kz_{mix}}}{kz_{mix}} \tag{1}\]
Where \(I_u\) is the sub-surface solar irradiance, \(k\) is the light extinction coefficient, and \(z_{mix}\) is the mixing depth. Considering the well-mixed characteristics of the water body in QCS Reservoir, \(z_{mix}\) is equivalent to the water depth (\(z_{max}\)).
Regarding the culture experiment, the cell growth rate at the logarithmic phase (μ, d-1) was calculated based on the cell density increase (\(N_{t_2}/N_{t_1}\)) over time (\(t_2-t_1\), d) (Eq. 2), which was determined by the slope of \(\log\)-linear model between \(N_t\) and \(t\).
\[ \mu = \frac{\ln{N_{t_2}}-\ln{N_{t_1}}}{t_2-t_1} \tag{2}\]
The instantaneous cellular MIB yield (\(Y_t = c_t/N_t\)) was determined according to the instant total MIB concentration (\(c_t\), including cell-bound MIB and dissolved MIB) and cell density (\(N_t\)). The mean cellular MIB yield (\(Y\)) was determined according to the mean of all instantaneous cellular MIB yields within the late logarithmic phase and stationary phase for each experiment set. Linear regression, one-way analysis of variance (ANOVA), and Pearson’s correlations were performed by the vegan package (Oksanen et al., 2014). The figures were visualized using the ggplot2 package (Wickham, 2009) and ArcGIS v.10.7.
Results
Limnological characteristics
Seasonal MIB episodes lasting for one to two months have been typically observed in the period from Apr. and Jun. in QCS Reservoir since 2016, according to the historical record (data not shown). In 2021, the MIB episode started in the end of April, and ended in late May 25. The solar irradiance varied between 210.6 μmol photons m-2 s-1 and 761.8 μmol photons m-2 s-1 (Fig. S5), meanwhile, the underwater light intensity varied between 15.7 μmol photons m-2 s-1 and 51.1 μmol photons m-2 s-1. The air temperature was 21.6 °C and showed 4.4 °C variance. In comparison, the water temperature showed a much smaller variance of 1.8 °C with mean value of 20.2 °C during the episode in 2021 (Fig. S5), and no significant spatial difference between Upstream river water (URW) and reservoir water was observed (p = 0.631). The water level was 2.48 ± 0.25 m and hydraulic retention time was 16.7 ± 4.9 d. The dissolved oxygen (DO), pH, and secchi depth (SD) in URW were significantly lower than those in reservoir water (p < 0.01), while the turbidity, total phosphorus (TP), total nitrogen (TN), and nitrate (NO3-N) in URW were significantly higher (p < 0.01). No significant spatial difference was observed for ammonia (NH4-N, p = 0.096).
| I | Tair | Wind | Rainfall | Water level | HRT |
|---|---|---|---|---|---|
| (μmol m-2s-1) | (°C) | (m s-1) | (mm d-1) | (m) | (d) |
| 607 ± 179 | 21.6 ± 4.4 | 2.93 ± 1.55 | 4.34 ± 11.57 | 2.48 ± 0.25 | 16.7 ± 4.9 |
| Parameters | URW | NB | SB | MS | Sig. |
|---|---|---|---|---|---|
| Twater (°C) | 20.2 ± 1.8 | 20.3 ± 1.8 | 20.4 ± 1.6 | 20.0 ± 1.9 | 0.631 |
| DO (mg L-1) | 8.7 ± 0.6 | 9.2 ± 1.2 | 8.8 ± 1.0 | 9.6 ± 0.8 | 0.000 |
| pH | 8.2 ± 0.07 | 8.7 ± 0.1 | 8.3 ± 0.2 | 8.6 ± 0.1 | 0.000 |
| SD (cm) | 41 ± 14 | 65 ± 18 | 44 ± 9 | 77 ± 17 | 0.000 |
| Turb. (NTU) | 52.2 ± 39.9 | 10.6 ± 4.9 | 18.3 ± 6.0 | 8.2 ± 3.2 | 0.000 |
| TP (mg L-1) | 0.09 ± 0.03 | / | / | 0.05 ± 0.01 | 0.000 |
| TN (mg L-1) | 1.96 ± 0.09 | / | / | 1.61 ± 0.11 | 0.000 |
| Nitrate (mg L-1) | 1.77 ± 0.08 | / | / | 1.37 ± 0.09 | 0.000 |
| Ammonia (mg L-1) | 0.07 ± 0.02 | / | / | 0.06 ± 0.02 | 0.096 |
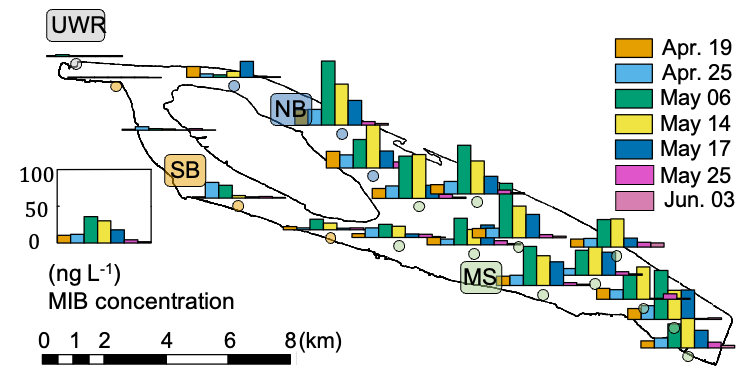
| MIB (ng L-1) | 1.3 ± 0.5 | 22.1 ± 22.6 | 3.7 ± 5.3 | 20.5 ± 18.5 | 0.000 |
In 2021, a rapid increase in MIB occurred at the end of Apr. and peaked in the middle of May with the highest concentration (99.0 ng L-1) detected at QC10 on May 10, and subsequently it decreased to below the odor threshold (10.0 ng L-1) on May 25 (Fig. 1). No serious MIB problem was observed in upstream river water (URW) and the south branch (SB) of the reservoir. MIB concentrations at the middle section (MS) and the north branch (NB) were significantly higher than those of URW (p < 0.01) and SB (p < 0.01).
Dynamics of phytoplankton community structure
A total of 21 cyanobacterial genera and 55 genera affiliated with 6 other phyla were recorded during the investigation according to microscopic cell counting results. The phytoplankton communities showed significant temporal (PERMANOVA, R2 = 0.14, F = 2.988, p < 0.001) and spatial (PERMANOVA, R2 = 0.13, F = 1.846, p = 0.015) differences (Fig. S6). Cyanophyta and Bacillariophyta were the two dominant phyla over the investigation period from Apr. to Jun. The abundance of Cyanophyta peaked on May 10 (4.4 × 10⁶ cells L-1), but decreased quickly to (1.0 × 10⁶) cells L-1 on May 17, leaving Bacillariophyta ((3.0 ± 1.0) × 106 cells L-1) and Chlorophyta ((9.4 ± 8.0) × 105 cells L-1) as the dominant phyla (Fig. 2B). The cell density of Pseudanabaena, a well-known potential MIB producer, increased from Apr.19 (4.6 × 10⁵ cells L-1) to May 12 (4.8 × 10⁶ cells L-1), then decreased to (1.3 × 10⁵ cells L-1) on May 21 (Fig. 2A), exhibiting a similar temporal pattern as the MIB concentration (R2 = 0.28, p < 0.01, Fig. S7).
The mic gene was detected in 133 water samples collected from QCS Reservoir during the MIB episode. The genes’ order in the MIB operon was determined as illustrated in Fig. 2C. The mic gene was located between the mtf gene and cnb B gene, suggesting that MIB was produced by the cyanobacteria (Devi et al., 2021). The mic gene sequences were subsequently determined to explore the potential MIB producers together with microscopic results. Pseudanabaena was identified as the dominant MIB contributor (accounting for 82.7% of the MIB-producing cyanobacterial community) by the annotation of mic gene sequences (Fig. 2C); Oscillatoria, at the same time, contributed 5.1%. Furthermore, 3 Pseudanabaena strains were isolated from the QCS water samples, with Pseudanabaena cinerea being determined as the main MIB producer in QCS Reservoir according to the MIB production potential test (Table S2).

Correlation between MIB concentration and mic gene abundance
The spatial and temporal patterns of mic gene abundances (DNA and RNA) are shown in Fig. 3A, which agreed well with the MIB distribution. The mic gene abundances (DNA or RNA) of NB and MS were significantly higher than URW (p < 0.01) and SB (p < 0.01). In general, DNA reached the peak values earlier than RNA.
Daily samples at NB (QC10) were further analyzed to reveal the temporal dynamics of the total MIB concentrations and mic gene abundances (DNA and RNA). The highest MIB concentration (99 ng L-1, Fig. 3C) was detected on May 10, while the highest DNA (3.67 × 10⁷ copies L-1, Apr. 30) and RNA (2.03 × 10⁷ copies L-1, May 3) abundances of the mic gene occurred earlier than the peak MIB concentration (Fig. 3B).
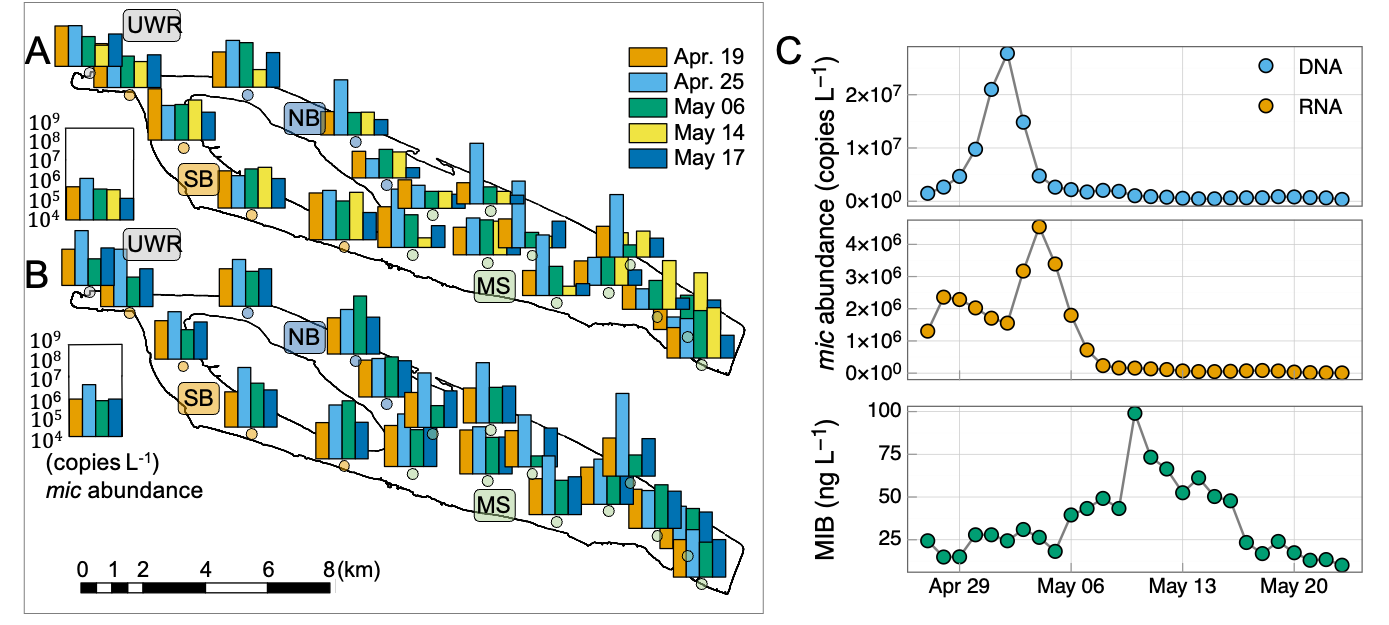
Time-shifted pairwise Pearson’s correlation analysis was performed to evaluate the lag time between mic gene abundance and MIB concentration. The highest correlations with MIB concentration were obtained at 10 lag days for DNA and 7 lag days for RNA, respectively (Fig. 4A). Furthermore, RNA abundance of mic gene (R2 = 0.45, p < 0.01, Fig. 4C) showed a little higher correlation with MIB concentration than the DNA abundance (R2 = 0.37, p < 0.01, Fig. 4B). The mean mic gene quota (MIB production per mic gene copy) was 33 and 181 (fg / mic gene copy) for DNA and RNA, respectively.
The earlier peak of mic gene abundance compared to MIB concentration was also observed in JZ Reservoir and LH Reservoir. In JZ Reservoir, The highest DNA abundance (5.02 × 10⁵ copies L-1) and MIB concentration (147 ng L-1) were detected on Aug. 5 and Aug. 20, respectively. Similar result has been found in LH Reservoir, the highest DNA abundance (7.32 × 10⁶ copies L-1) and MIB concentration (72 ng L-1) were detected on May 23 and Jun. 14, respectively.

Driving factors for mic gene expression
Driving factors responsible for mic gene expression were explored to reveal the differences in the temporal variations between the DNA and RNA abundances of mic gene during the MIB episode. Water temperature and nutrients were excluded as the major driving factors since no correlation was obtained with mic gene abundances (Fig. S9). Only the light intensity was positively correlated with the RNA abundance of mic gene (R2 = 0.44, p < 0.01, Fig. 5B), though no correlation was observed with DNA abundance (R2 = 0.02, p = 0.64, Fig. 5A).

Further, a culture experiment using Pseudanabaena cinerea FACHB 1277 (the major contributor to MIB in QCS Reservoir) was performed to investigate the effects of light intensity on cell growth, MIB production, and mic gene expression level (Fig. 6). The highest cell growth rate (0.26 ± 0.03) d -1 was obtained under moderate light intensity (36 μmol photons m-2 s-1). Meanwhile, the maximum cell density (1.3 ± 0.3) × 1010 cells L-1 and MIB concentration (897 ± 75) μg L-1 were also observed at 36 μmol photons m-2 s-1.
Different from the optimum light intensity for cell growth, the maximum cellular MIB yield (0.15 ± 0.04) pg cell-1 was achieved at 85 μmol photons m-2 s-1. The expression level of mic gene (normalized by cell density) was roughly stable along the culture period under a certain light intensity, but responded to diverse light intensities. The mic gene expression level increased by 50 % under 85 μmol photons m-2 s-1 compared to 36 μmol photons m-2 s-1, but higher light intensity (250 μmol photons m-2 s-1) could inhibit the mic gene expression (Fig. 6E).

Discussion
MIB episodes in QCS Reservoir
Widespread musty odor events caused by MIB have been increasingly reported in recent decades, raising considerable public attention (Devi et al., 2021; Lee et al., 2017). Cyanobacteria (Lee et al., 2017) and actinomycetes (Zaitlin and Watson, 2006; Zuo et al., 2010) have been widely accepted as the main MIB producers, although the dominant source for a specific water body is sometimes controversial. Previous studies have revealed that the cyclic nucleotide-binding protein genes (cnb A and cnb B), methyl transferase gene (mtf), and MIB cyclase gene (mic) are associated with MIB biosynthesis (Giglio et al., 2011; Komatsu et al., 2008). The order of these genes within cyanobacteria (cnbA - mtf - mic - cnbB) is different from that in most of the actinomycetes (cnb - mic - mtf) because of the occurrence of recombinant events during evolution (Devi et al., 2021). In QCS Reservoir, the genes’ order in the MIB operon (cnbA, followed by mtf, mic, and cnbB) indicates that cyanobacteria are the major contributor to the MIB episode.
All of the microscopic, high-throughput sequencing and pure culture results revealed that Pseudanabaena cinerea was the dominant MIB producer in 2021, though Oscillatoria might have also contributed slightly to the MIB episode. Previous studies in general only focused on one MIB producer for a specific MIB episode (Huang et al., 2018; Su et al., 2021). This study shows that the ecological niche in QCS Reservoir could support two MIB-producing genera. The dominant MIB-producing species may be different in different years since the environmental conditions may change. At the same time, it should be noted that there were also two other Pseudanabaena species (P. limnetica and P. catenate) which could not produce MIB, which is easy to understand since the same genera usually favor similar niches. This study clearly shows that microscopic identification alone (Fig. S8) is therefore not sufficient to identify the MIB producers, considering the co-occurrence of MIB-producing Pseudanabaena and non-MIB producing Pseudanabaena, and the cell lysis when MIB release.
Early warning of MIB episode based on mic gene abundance and expression
Quantification of MIB synthesis genes has been regarded as a sensitive and rapid method for the evaluation of the MIB production potential in drinking water sources (Chiu et al., 2016; Kim et al., 2020; Lu et al., 2019; Rong et al., 2018; Wang and Li, 2015), which can be completed within one day from samples collection to result analysis, and the cost is lower than GC-MS analysis. This study clearly demonstrates for the first time that the detection of the mic gene could be used as an effective early warning approach for an MIB episode since the peaks of the DNA and RNA abundances arrived 10 and 7 days earlier than that of MIB concentration. The mic gene has been reported as single copy in the genome of Pseudanabaena, Planktothricoides and the majority of actinomycetes (Giglio et al., 2011; Komatsu et al., 2008; Wang et al., 2011), indicating a consistent correlation between mic gene abundance and P. cinerea cell density. Moreover, early total Pseudanabaena abundance increases were observed before May 10 according to microscopic cell counting, suggesting P. cinerea probably the dominant Pseudanabaena species in the early stage. Since intracellular MIB is mainly released into water during the stationary/death phase (Alghanmi et al., 2018), we speculate that the massive breakdown of P. cinerea cells before May 10 resulted in the instant MIB increases in QCS Reservoir. In addition, the transportation and diffusion processes of MIB were also important reasons for the 7 ~ 10 days’ delay of MIB episodes in comparison with the dynamics of mic gene abundance. Previous studies showed that short hydraulic retention time (HRT) could inhibit cyanobacterial growth via disrupt and dilute processes, and HRT was positively correlated with cyanobacterial abundance (Lee et al., 2012; Rangel et al., 2012). Further study is still required to obtain the relationship between hydrodynamics and the time lag.
This real-time PCR-based approach is particularly important considering the fact that only one among the three Pseudanabaena strains isolated from the episode samples exhibited the potential to produce MIB. If the waterworks could predict the occurrence of the peak MIB concentrations 7 or 10 days earlier, they could have sufficient time to take measures to cope with the episode. They can change the source water, regulating the flow rate, preparing PAC for MIB removal, or reduce the problematic source water to ensure sufficient adsorption time since the adsorption of MIB mainly occurs in the micropores of PAC, requiring long adsorption time (Yu et al., 2007).
Since the mic gene is essential for MIB production regardless of taxonomy, this method can be applied to all MIB episodes. Though the RNA-based gene abundance (R2 = 0.44) is slightly more accurate than the DNA-based one (R2 = 0.37), DNA detection may be a more practical approach since the detection of DNA is easier, and the advance time (10 days) is longer. This advance time was in accordance with a previous study on microcystin production (7 days; (Lu et al., 2020)). The mic gene-based early warning function was also validated by application in 2 drinking water reservoirs (JZ Reservoir and LH Reservoir, Fig. S12). Both applications exhibited an earlier peak of mic gene abundance compared to the MIB concentration, though the advance days cannot be accurately confirmed due to the low sampling frequency. This further supports the validation of this technology for early warning purpose, although the number of advance days should be adjusted before application due to physiological differences between MIB producers and differences in the hydrodynamics of reservoirs/lakes.
Driving factors for MIB production
MIB production in actual water is governed by the growth of MIB producer(s), the expression level of MIB synthesis gene and hydrological transportation of MIB diffusion. As a result, the correlation between observed MIB concentration and abundance of MIB producer(s) is not strong, e.g., in this study the correlation coefficient between Pseudanabaena cell density and MIB concentration is 0.28, and the MIB concentration can only be modeled using quantile regression in Miyun Reservoir (Su et al., 2015). It suggests that the gene expression should be emphasized. Noted that, RNA abundance of mic gene is a better indicator of MIB dynamics compared to DNA abundance, with 8% variance differences, indicating that the mic gene expression is governed by other factors during the MIB episode.
Water temperature, nutrients and light availability have been considered to be key factors affecting the growth and MIB production of cyanobacteria. For Pseudanabaena, higher temperature could promote cell growth (25-35 °C), MIB production (Izaguirre and Taylor, 2007; Wang and Li, 2015; Zhang et al., 2016) and mic gene expression (30 °C) (Kakimoto et al., 2014). However, no significant correlation between water temperature and mic gene abundances (DNA or RNA) was observed in QCS Reservoir, probably owing to the small temperature variations (17.2 °C to 26.0 °C) during the MIB episode. The uncorrelated relationship between nutrients concentration and mic gene abundances (DNA and RNA) in QCS Reservoir further supports that nutrients are probably not the key factor governing mic gene expression. Nutrients are generally not the limiting factor for MIB producers, as they prefer to stay in the subsurface/bottom layers of the water column, where nutrients from sediments can satisfy their demand (Su et al., 2021, 2019), which is why prevalent MIB episodes usually occur in mesotrophic/oligotrophic reservoirs/lakes (Su et al., 2019).
Cyanobacteria capture light photons by using photosynthetic pigments including chlorophyll a and phycobillins through photosynthesis (Wiltbank and Kehoe, 2019). MIB biosynthesis shares a common precursor with chlorophyll a (Zimba et al., 1999), therefore the ambient light condition probably is an essential regulator that governs the cell growth (indicator of chlorophyll a biosynthesis) and MIB production for cyanobacteria, as also observed in other culture experiments (Jia et al., 2019; Li et al., 2012; Su et al., 2023; Wang and Li, 2015). Our culture result indicates that Pseudanabaena cannot grow under light intensity as low as 5 μmol photons m-2 s-1, consistent with (Zhang et al., 2016); optimized growth was obtained under 36 μmol photons m-2 s-1, but maximum cellular MIB production was obtained under 85 μmol photons m-2 s-1. This result is also consistent with (Zhang et al., 2016), showing that the optimum light intensities for cell growth and MIB production were 25 and 40 μmol photons m-2 s-1, respectively. The mic gene expression was promoted along with the increase in light intensity from 17 to 85 μmol photons m-2 s-1, resulting in incremental cellular MIB yield. Nevertheless, the level of mic gene expression in response to light is strain-specific according to comparison with another independent study (Wang et al., 2011), which revealed that the mic gene expression of Pseudanabaena sp. dqh15 was inhibited under 60 μmol m-2 s-1 compared to 30 μmol m-2 s-1.
Meanwhile, the mean underwater light intensity varied between 15.7 and 51.1 μmol photons m-2 s-1 during the MIB episode in QCS Reservoir (Fig. S10). It is interesting that the light intensity was positively correlated with the mic gene abundance of RNA (R2 = 0.44, p < 0.01), but not with DNA (R2 = 0.02, p = 0.64). It is possible that the light fluctuation during the MIB episode was not big enough to affect the cell growth of Pseudanabaena. However, the result clearly shows that the mic gene expression was more sensitive to underwater light intensity than was cell growth, which was in accordance with the pure culture experiment. In QCS Reservoir, the relatively higher light intensity (46.3 ± 5.1 μmol photons m-2 s-1) during the period Apr. 29 to May 3 may have caused the observed increase in MIB concentration 7 days later (from May 6 to May 10, Fig. S10). This light response feature of Pseudanabaena means that the production of MIB may be greatly reduced even for abundant MIB producers if the light availability is not favorable for the expression of the mic gene. Therefore, although the detection of DNA is used for early warning of the MIB episode, the detection of RNA is also desirable for a more accurate prediction, and the light intensity should be also an important predictor.
Conclusion
According to investigation of an MIB episode in QCS Reservoir, and a culture experiment for Pseudanabaena cinerea, the following conclusions can be drawn. 1) P. cinerea was identified as the major MIB producer in QCS Reservoir during the investigation in 2021. 2) mic gene expression level is light dependent, in particular, relatively higher light intensity results in increasing cellular MIB yield when underwater light intensity is proper for their growth. 3) The mic DNA abundance and expression can be used for early warning puropse with 7 ~ 10 days forecasts, offering a valuable time gap for control measures and emergency operation.
Notes
The authors declare no competing financial interest.
Acknowledgements
This work was financially supported by the National Natural Science Foundation of China (51878649, 52030002), Shanghai Chengtou Raw Water Co. Ltd., and Youth Innovation Promotion Association CAS.
References
Alghanmi, H.A., Alkam, F.M., AL-Taee, M.M., 2018. Effect of light and temperature on new cyanobacteria producers for geosmin and 2-methylisoborneol. Journal of Applied Phycology 30, 319–328. https://doi.org/10.1007/s10811-017-1233-0
Anderson, M.J., 2017. Permutational multivariate analysis of variance (PERMANOVA). https://doi.org/10.1002/9781118445112.stat07841
Chiu, Y., Yen, H., Lin, T., 2016. An alternative method to quantify 2-MIB producing cyanobacteria in drinking water reservoirs: Method development and field applications. Environmental Research 151, 618–627. https://doi.org/10.1016/j.envres.2016.08.034
Clarke, K.R., Gorley, R.N., 2015. Primer v7: User manual/tutorial. PRIMER-e: Plymouth.
Cook, D., Newcombe, G., Sztajnbok, P., 2001. The application of powdered activated carbon for MIB and geosmin removal: Predicting PAC doses in four raw waters. Water Research 35, 1325–1333. https://doi.org/10.1016/S0043-1354(00)00363-8
Devi, A., Chiu, Y.-T., Hsueh, H.-T., Lin, T.-F., 2021. Quantitative PCR based detection system for cyanobacterial geosmin/2-methylisoborneol (2-MIB) events in drinking water sources: Current status and challenges. Water Research 188, 116478. https://doi.org/10.1016/j.watres.2020.116478
Dixon, P., 2003. VEGAN, a package of r functions for community ecology. Journal of Vegetation Science 14, 927–930. https://doi.org/10.1111/j.1654-1103.2003.tb02228.x
Edgar, R.C., 2013. UPARSE: Highly accurate OTU sequences from microbial amplicon reads. Nature Methods 10, 996–998. https://doi.org/10.1038/nmeth.2604
Gerber, N.N., 1979. Volatile Substances from Actinomycetes: Their Role in the Odor Pollution of Water. CRC Critical Reviews in Microbiology 7, 191–214. https://doi.org/10.3109/10408417909082014
Giglio, S., Chou, W.K.W., Ikeda, H., Cane, D.E., Monis, P.T., 2011. Biosynthesis of 2-methylisoborneol in cyanobacteria. Environmental Science & Technology 45, 992–998. https://doi.org/10.1021/es102992p
Halstvedt, C.B., Rohrlack, T., Andersen, T., Skulberg, O., Edvardsen, B., 2007. Seasonal dynamics and depth distribution of Planktothrix spp. In Lake Steinsfjorden (Norway) related to environmental factors. Journal of Plankton Research 29, 471–482. https://doi.org/10.1093/plankt/fbm036
Huang, X., Huang, Z., Chen, X., Zhang, D., Zhou, J., Wang, X., Gao, N., 2018. The predominant phytoplankton of Pseudoanabaena holding specific biosynthesis gene-derived occurrence of 2-MIB in a drinking water reservoir. Environmental Science and Pollution Research 25, 19134–19142. https://doi.org/10.1007/s11356-018-2086-z
Izaguirre, G., Taylor, W., 2007. Geosmin and MIB events in a new reservoir in southern california. Water Science & Technology 55, 9–14.
Jia, Z., Su, M., Liu, T., Guo, Q., Wang, Q., Burch, M., Yu, J., Yang, M., 2019. Light as a possible regulator of MIB-producing Planktothrix in source water reservoir, mechanism and in-situ verification. Harmful Algae 88, 101658. https://doi.org/10.1016/j.hal.2019.101658
Kakimoto, M., Ishikawa, T., Miyagi, A., Saito, K., Miyazaki, M., Asaeda, T., Yamaguchi, M., Uchimiya, H., Kawai-yamada, M., 2014. Culture temperature affects gene expression and metabolic pathways in the 2-methylisoborneol-producing cyanobacterium Pseudanabaena galeata. Journal of Plant Physiology 171, 292–300. https://doi.org/10.1016/j.jplph.2013.09.005
Kim, K., Yoon, Y., Cho, H., Hwang, S.-J., 2020. Molecular probes to evaluate the synthesis and production potential of an odorous compound (2-methylisoborneol) in cyanobacteria. International Journal of Environmental Research and Public Health 17, 1933. https://doi.org/10.3390/ijerph17061933
Komarek, J., Kastovsky, J., Mares, J., Johansen, J.R., 2014. Taxonomic classification of cyanoprokaryotes (cyanobacterial genera) 2014, using a polyphasic approach. Preslia 86, 295–335.
Komatsu, M., Tsuda, M., omura, S., Oikawa, H., Ikeda, H., 2008. Identification and functional analysis of genes controlling biosynthesis of 2-methylisoborneol. Proceedings of the National Academy of Sciences 105, 7422–7427. https://doi.org/10.1073/pnas.0802312105
Kruskal, J.B., 1964. Nonmetric multidimensional scaling: A numerical method. Psychometrika 29, 115–129. https://doi.org/10.1007/bf02289694
Lanciotti, E., Santini, C., Lupi, E., Burrini, D., 2003. Actinomycetes, cyanobacteria and algae causing tastes and odours in water of the river arno used for the water supply of Florence. Journal of Water Supply: Research and Technology-Aqua 52, 489–500. https://doi.org/10.2166/aqua.2003.0044
Lee, J., Rai, P.K., Jeon, Y.J., Kim, K.-H., Kwon, E.E., 2017. The role of algae and cyanobacteria in the production and release of odorants in water. Environmental Pollution 227, 252–262. https://doi.org/10.1016/j.envpol.2017.04.058
Lee, S., Lee, S., Kim, S.H., Park, H., Park, S., Yum, K., 2012. Examination of critical factors related to summer chlorophyll a concentration in the sueo dam reservoir, republic of korea. Environmental Engineering Science 29, 502–510. https://doi.org/10.1089/ees.2011.0070
Li, Z., Hobson, P., An, W., Burch, M.D., House, J., Yang, M., 2012. Earthy odor compounds production and loss in three cyanobacterial cultures. Water Research 46, 5165–5173. https://doi.org/10.1016/j.watres.2012.06.008
Lu, J., Struewing, I., Wymer, L., Tettenhorst, D.R., Shoemaker, J., Allen, J., 2020. Use of qPCR and RT-qPCR for monitoring variations of microcystin producers and as an early warning system to predict toxin production in an Ohio inland lake. Water Research 170, 115262. https://doi.org/10.1016/j.watres.2019.115262
Lu, J., Su, M., Su, Y., Wu, B., Cao, T., Fang, J., Yu, J., Zhang, H., Yang, M., 2022. Driving forces for the growth of MIB-producing Planktothricoides raciborskii in a low-latitude reservoir. Water Research 118670. https://doi.org/10.1016/j.watres.2022.118670
Lu, K.-Y., Chiu, Y.-T., Burch, M., Senoro, D., Lin, T.-F., 2019. A molecular-based method to estimate the risk associated with cyanotoxins and odor compounds in drinking water sources. Water Research 164, 114938. https://doi.org/10.1016/j.watres.2019.114938
Magoc, T., Salzberg, S.L., 2011. FLASH: Fast length adjustment of short reads to improve genome assemblies. Bioinformatics 27, 2957–2963. https://doi.org/10.1093/bioinformatics/btr507
Oksanen, J., Blanchet, F.G., Kindt, R., Legendre, P., Minchin, P.R., O’hara, R.B., Simpson, G.L., Solymos, P., Stevens, M.H.H., Wagner, H., 2014. Vegan: Community ecology package.
Persson, P.-E., 1996. Cyanobacteria and off-flavours. Phycologia 35, 168–171. https://doi.org/10.2216/i0031-8884-35-6s-168.1
Qiu, P., Chen, Y., Li, C., Huo, D., Bi, Y., Wang, J., Li, Y., Li, R., Yu, G., 2021. Using molecular detection for the diversity and occurrence of cyanobacteria and 2-methylisoborneol-producing cyanobacteria in an eutrophicated reservoir in Northern China. Environmental Pollution 288, 117772. https://doi.org/10.1016/j.envpol.2021.117772
R Core Team, 2020. R: A language and environment for statistical computing. R Foundation for Statistical Computing, Vienna, Austria.
Rangel, L.M., Silva, L.H.S., Rosa, P., Roland, F., Huszar, V.L.M., 2012. Phytoplankton biomass is mainly controlled by hydrology and phosphorus concentrations in tropical hydroelectric reservoirs. Hydrobiologia 693, 13–28. https://doi.org/10.1007/s10750-012-1083-3
Rong, C., Liu, D., Li, Y., Yang, K., Han, X., Yu, J., Pan, B., Zhang, J., Yang, M., 2018. Source water odor in one reservoir in hot and humid areas of southern China: Occurrence, diagnosis and possible mitigation measures. Environmental Sciences Europe 30. https://doi.org/10.1186/s12302-018-0175-8
Su, M., An, W., Yu, J., Pan, S., Yang, M., 2014. Importance of underwater light field in selecting phytoplankton morphology in a eutrophic reservoir. Hydrobiologia 724, 203–216. https://doi.org/10.1007/s10750-013-1734-z
Su, M., Andersen, T., Burch, M., Jia, Z., An, W., Yu, J., Yang, M., 2019. Succession and interaction of surface and subsurface cyanobacterial blooms in oligotrophic/mesotrophic reservoirs: A case study in Miyun Reservoir. Science of the Total Environment 649, 1553–1562. https://doi.org/J.scitotenv.2018.08.307
Su, M., Fang, J., Jia, Z., Su, Y., Zhu, Y., Wu, B., Little, J.C., Yu, J., Yang, M., 2023. Biosynthesis of 2-methylisoborneol is regulated by chromatic acclimation of pseudanabaena. Environmental Research 115260. https://doi.org/10.1016/j.envres.2023.115260
Su, M., Yu, J., Zhang, J., Chen, H., An, W., Vogt, R.D., Andersen, T., Jia, D., Wang, J., Yang, M., 2015. MIB-producing cyanobacteria (Planktothrix sp.) in a drinking water reservoir: Distribution and odor producing potential. Water Research 68, 444–453. https://doi.org/10.1016/j.watres.2014.09.038
Su, M., Zhu, Y., Jia, Z., Liu, T., Yu, J., Burch, M., Yang, M., 2021. Identification of MIB producers and odor risk assessment using routine data: A case study of an estuary drinking water reservoir. Water Research 192, 116848. https://doi.org/10.1016/j.watres.2021.116848
Sun, D., Yu, J., An, W., Yang, M., Chen, G., Zhang, S., 2013. Identification of causative compounds and microorganisms for musty odor occurrence in the Huangpu River, China. Journal of Environmental Sciences 25, 460–465. https://doi.org/10.1016/s1001-0742(12)60012-6
Suruzzaman, M., Cao, T., Lu, J., Wang, Y., Su, M., Yang, M., 2022. Evaluation of the MIB-producing potential based on real-time qPCR in drinking water reservoirs. Environmental Research 112308. https://doi.org/10.1016/j.envres.2021.112308
Wang, Z., Li, R., 2015. Effects of light and temperature on the odor production of 2-methylisoborneol-producing Pseudanabaena sp. And geosmin-producing Anabaena ucrainica (cyanobacteria). Biochemical Systematics and Ecology 58, 219–226. https://doi.org/10.1016/j.bse.2014.12.013
Wang, Z., Xu, Y., Shao, J., Wang, J., Li, R., 2011. Genes associated with 2-methylisoborneol biosynthesis in cyanobacteria: Isolation, characterization, and expression in response to light. Plos One 6, E18665. https://doi.org/10.1371/journal.pone.0018665
Watson, S.B., Monis, P., Baker, P., Giglio, S., 2016. Biochemistry and genetics of taste- and odor-producing cyanobacteria. Harmful Algae 54, 112–127. https://doi.org/10.1016/j.hal.2015.11.008
Watson, S.B.W.S., Ridal, J.R.J., Boyer, G.L.B.G., 2008. Taste and odour and cyanobacterial toxins: Impairment, prediction, and management in the great lakes. Canadian Journal of Fisheries and Aquatic Sciences 65, 1779–1796. https://doi.org/10.1139/f08-084
Wickham, H., 2009. Introduction, in: ggplot2. Springer New York, pp. 1–7. https://doi.org/10.1007/978-0-387-98141-3_1
Wiltbank, L.B., Kehoe, D.M., 2019. Diverse light responses of cyanobacteria mediated by phytochrome superfamily photoreceptors. Nature Reviews Microbiology 17, 37–50. https://doi.org/10.1038/s41579-018-0110-4
Wu, T., Zhu, G., Zhu, M., Xu, H., Yang, J., Zhao, X., 2021. Effects of algae proliferation and density current on the vertical distribution of odor compounds in drinking water reservoirs in summer. Environmental Pollution 288, 117683. https://doi.org/10.1016/j.envpol.2021.117683
Yang, M., Yu, J., Li, Z., Guo, Z., Burch, M., Lin, T., 2008. Taihu Lake not to blame for Wuxi’s Woes. Science 319, 158. https://doi.org/10.1126/science.319.5860.158a
Yu, J., Yang, M., Lin, T., Guo, Z., Zhang, Y., Gu, J., Zhang, S., 2007. Effects of surface characteristics of activated carbon on the adsorption of 2-methylisobornel (MIB) and geosmin from natural water. Separation and Purification Technology 56, 363–370. https://doi.org/10.1016/j.seppur.2007.01.039
Zaitlin, B., Watson, S.B., 2006. Actinomycetes in relation to taste and odour in drinking water: Myths, tenets and truths. Water Research 40, 1741–1753. https://doi.org/10.1016/j.watres.2006.02.024
Zamyadi, A., Henderson, R., Stuetz, R., Hofmann, R., Ho, L., Newcombe, G., 2015. Fate of geosmin and 2-methylisoborneol in full-scale water treatment plants. Water Research 83, 171–183. https://doi.org/10.1016/j.watres.2015.06.038
Zhang, T., Zheng, L., Li, L., Song, L., 2016. 2-methylisoborneol production characteristics of Pseudanabaena sp. FACHB 1277 isolated from xionghe reservoir, China. Journal of Applied Phycology 1–10. https://doi.org/10.1007/s10811-016-0864-x
Zimba, P.V., Dionigi, C.P., Millie, D.F., 1999. Evaluating the relationship between photopigment synthesis and 2-methylisoborneol accumulation in cyanobacteria. Journal of Phycology 35, 1422–1429. https://doi.org/10.1046/j.1529-8817.1999.3561422.x
Zuo, Y., Li, L., Zhang, T., Zheng, L., Dai, G., Liu, L., Song, L., 2010. Contribution of Streptomyces in sediment to earthy odor in the overlying water in xionghe reservoir, China. Water Research 44, 6085–6094. https://doi.org/10.1016/j.watres.2010.08.001